

Stock Markets in Times of Uncertainty
Markets constantly move as investors attempt to predict what may or may not happen in the future. That is not entirely efficient, as many events and decisions can have a negative or positive impact that cannot be fully anticipated. Understandably, some events, like wars, are particularly nerve-racking and include periods of increased volatility. By looking at drawdowns, the time it takes stocks to rebound, and how much stocks gain after an initial drop, it is possible to gain a better sense of how to handle investments in times of uncertainty.
World War I
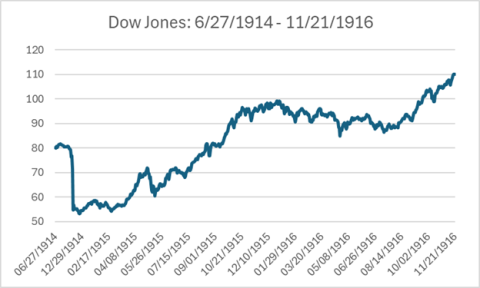
In 1914, stocks were stuck, moving slightly up, slightly down, but mostly sideways. As World War One began, markets reacted negatively. Within one month of the onset of the war, the Dow Jones Industrial Average had a drawdown of −11%. Fearing European countries’ liquidation of US securities, the authorities decided to halt trading on the Dow from close on July 30, 1914, until December 12, 1914, over four months. When the Dow reopened, it was down more than 30%, reaching a maximum drawdown of −34% by market close on Christmas Eve of 1914.
It would take until August 1915 for the Dow to return to its pre-war level, following a rebound of +53%. The upward move would continue until 11/21/1916 when the cumulative return from 12/24/1914 equaled +107.17%. A similar trend developed when the USA entered the war in early 1917.
World War II
1939 was a significantly more challenging year than 1914. Prior to the start of World War Two, the Dow was down over 13%. After an initial rebound at the beginning of the Second World War, US markets were slowly bleeding until May of 1940, when the invasion of Western Europe began, and more significant losses occurred. Even after the invasion of Western Europe, US markets were resilient. Down, but resilient.
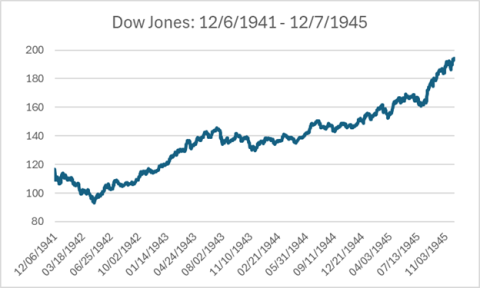
On December 7, 1941, the attack on Pearl Harbor occurred. An instant adverse reaction was seen in the Dow, with it experiencing a drawdown of −20.31% in just over four months. After that short period, however, the Dow steadily gained throughout the remainder of the war. The cumulative return from 4/28/1942 (date of max drawdown following Pearl Harbor) through V-J Day (USA date of celebration) was +87%. Annualized returns between Pearl Harbor and December 1945 (four years) were +13.58%.
Korean War
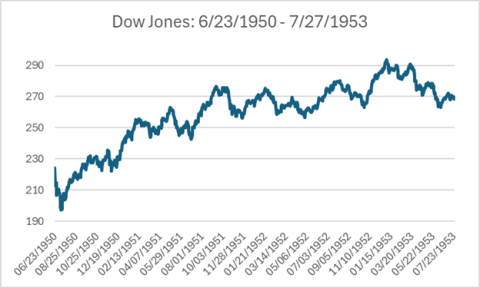
The next significant conflict that the USA was involved in was the Korean War. The Korean War occurred between June 25, 1950, and July 27, 1953. The maximum drawdown of the Dow following the coming of the war took only two and a half weeks to reach and was −11.99%. It took just two months for the Dow to return to its pre-war level. The cumulative return for the entirety of the war was around +20%. It was not the most substantial return, but it was well in the positive, nonetheless. If someone had sold the Dow at the point of maximum drawdown in this period, they would have missed much of the nearly +28% return in the following year.
Vietnam War
Not long after the Korean War came to its conclusion, the Vietnam War began. Over 20 years, the Second Indochina War was fought using many different methods over a period that was difficult in the USA for many reasons beyond the war. Due to this, it is much easier to look at a few particular events that happened during this period, starting with the Cuban Missile Crisis.
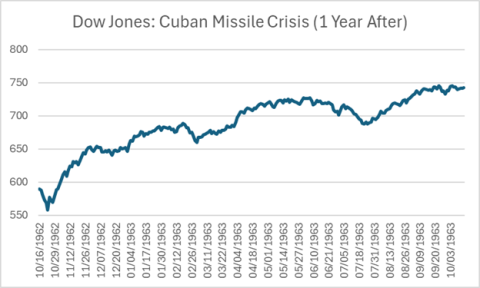
The Cuban Missile Crisis (10/16/1962 to 10/29/1962) has gone down in history as two of humanity’s most terrifying weeks. The United States and the Soviet Union were on the brink of nuclear war. Within one week of the crisis’ onset, the Dow was down −5.31%. By the end of the crisis on October 29, 1962, the Dow was nearly back to its prior level. One year after the onset of the Cuban Missile Crisis, the Dow was up +27.00%.
A year after the Cuban Missile Crisis, the assassination of President John F. Kennedy occurred. On the day of the President’s death, the Dow returned −2.89%. The next trading day, the Dow was up +4.50% and would return +21.58% over the next year.
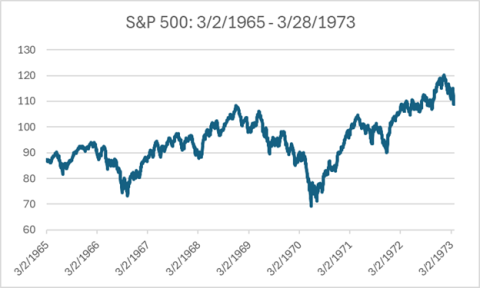
On March 2, 1965, Operation Rolling Thunder began. A few days later, on March 8, the first significant deployment of US ground troops arrived in Vietnam. Over eight years, a period which included the assassination of Martin Luther King Jr., the recession of 1969-1970, the reinstatement of the draft, the leak of the Pentagon Papers, and Watergate, the S&P 500 price return was around +27.7% (Around +3.2% annualized). Positive price returns through some of the United States’ darkest days.
Gulf War
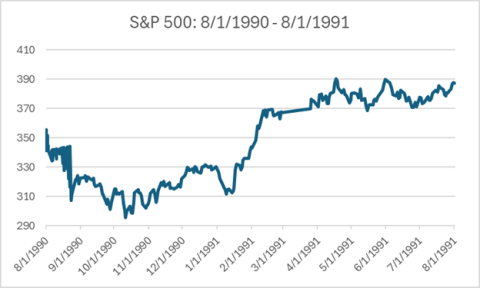
Moving forward from the 1970s to 1990, tensions in the Middle East were escalating, reaching a climax with Iraq’s invasion of Kuwait beginning on August 2. In a little over two months, the price level of the S&P 500 experienced a −17% drop. Following that point, the index rose +24.24% to the war’s end, just four and a half months later. One year on from the start of the conflict, the S&P 500 returned +8.89%, not accounting for distributions.
21st Century
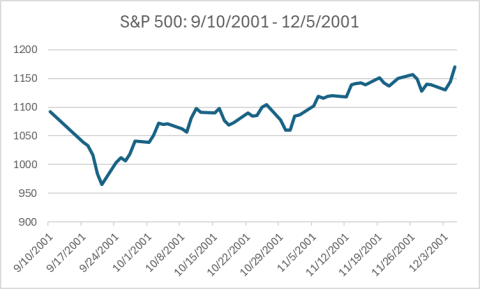
The next event is one of the darkest days of the 21st century and US history and is incredibly important to analyze when considering the stock market’s resiliency. Following the attacks of 9/11, the New York Stock Exchange and Nasdaq were closed for four trading days, reopening on September 17. Over the next five trading days, there was a drawdown of −11.60% (9/11 to 9/21). Over the next two and a half months, which included the start of the War in Afghanistan, the S&P 500 returned +21.18%.
In the years after 9/11, the United States entered Iraq. The buildup to the war, between December 2002 and March 2003, saw a downturn in the S&P 500 price of −14.71%, likely a further correction following the dot-com bubble bursting over the previous few years. The Iraq War had little impact on the stock market rebounding as the S&P 500 price gained +26.97% in the year following its commencement and would continue to grow at an annualized rate of +12.68% from the start of 2003 to the end of 2006.
2023-2024
As a more recent example of resiliency in stock markets following the start of a conflict, the Tel Aviv Stock Exchange is worth analyzing. Following October 7, 2023, the Tel Aviv 35 Index (TA-35), which consists of the 35 largest companies (market capitalization) listed on the exchange, had a return of −12.16%. It took only until December 18 for the TA-35 to return to its previous level. Today, the TA-35 is up around +10% since October 7. The return since the drawdown (10/26/2023) is +25.76% as of May 9, 2024.

Conclusion
Large stock markets have proven to be remarkably resilient over time. Even under frightening circumstances, markets tend to rebound, often much quicker than one might expect. While this data might seem to support the conclusion that markets always bounce back, it is essential to remember that past performance is not indicative of the future. There is no way to know how market participants might react to the next piece of negative or positive news.
Underlying index data from S&P Global and Yahoo Finance